Set Drill into URL
On dashboards, you can add drill interactions to your visualizations which will link the user to any URL you want. The URL can be made dynamic through the use of Visualization and Identifier parameters that change depending on what part of the visualization you click.
Note
Please note that:
- A visualization displaying multiple metrics, attributes, or both can have an independent drill interaction for each.
- Avoid using web pages with pop ups. If your drill points to a URL with a pop up window that gets blocked by your browser, the linked web page may not open.
- There is a known issue where using a Date-based visualization as a parameter in your URL may result in the link not working. This will be addressed in a future release.
Create a Drill into URL
In this example, you will add a drill interaction to a metric. The same procedure can be used to add a drill interaction to an attribute.
Steps:
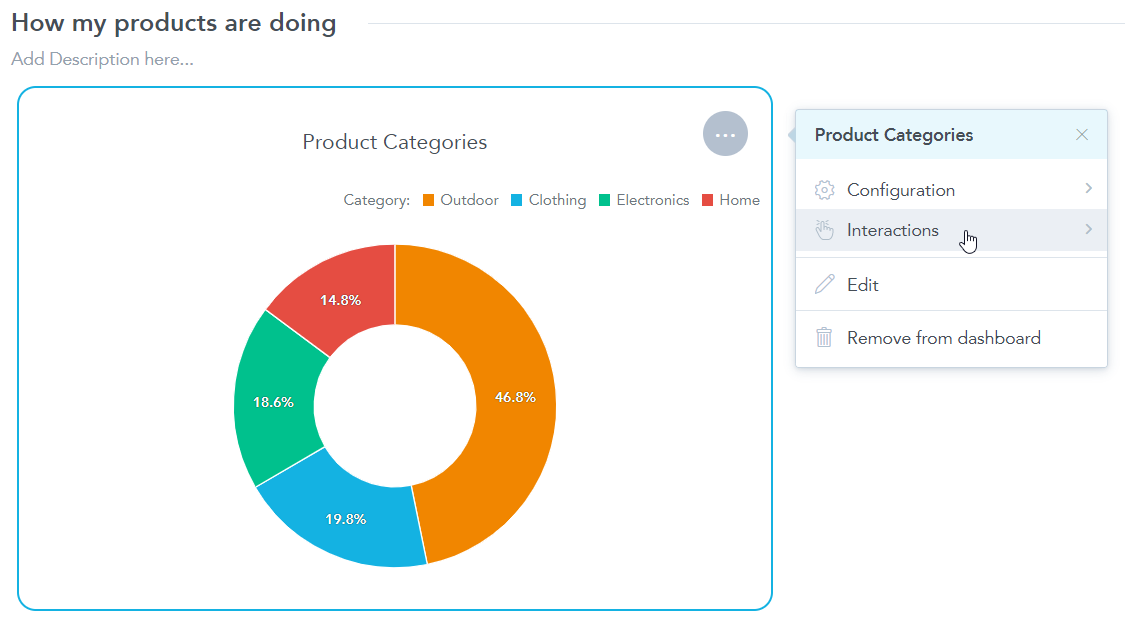
Edit your dashboard and click on the visualization that you want to set up a drill path for.
The options menu opens.
Select Interactions.
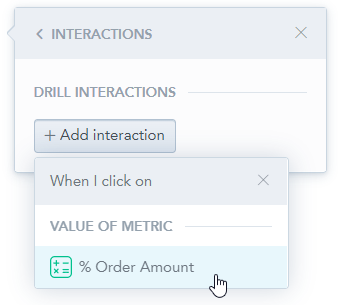
Click + Add interaction and select the metric you would like to drill in on.
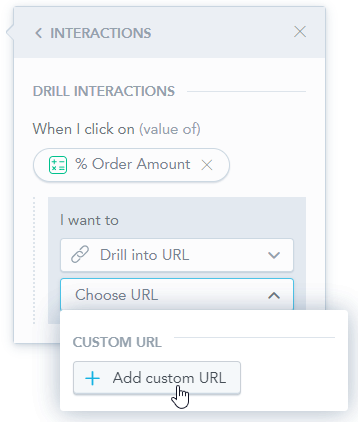
In the first dropdown menu, select Drill into URL.
In the second dropdown menu, select Add custom URL.
The Add custom URL dialog opens.
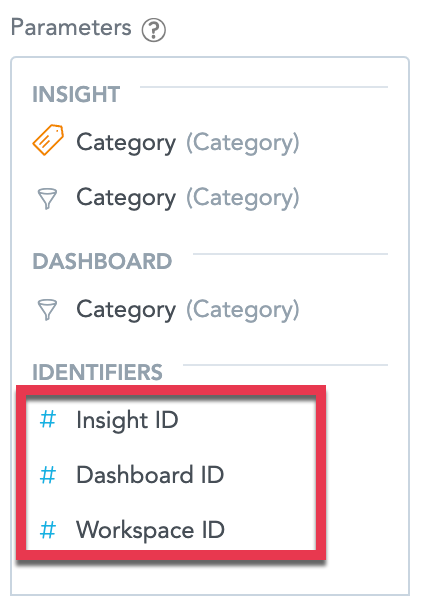
Create a URL you want to drill into and click Apply. Note that you may use parameters from the right side of the dialog to create a context-dependent URL.
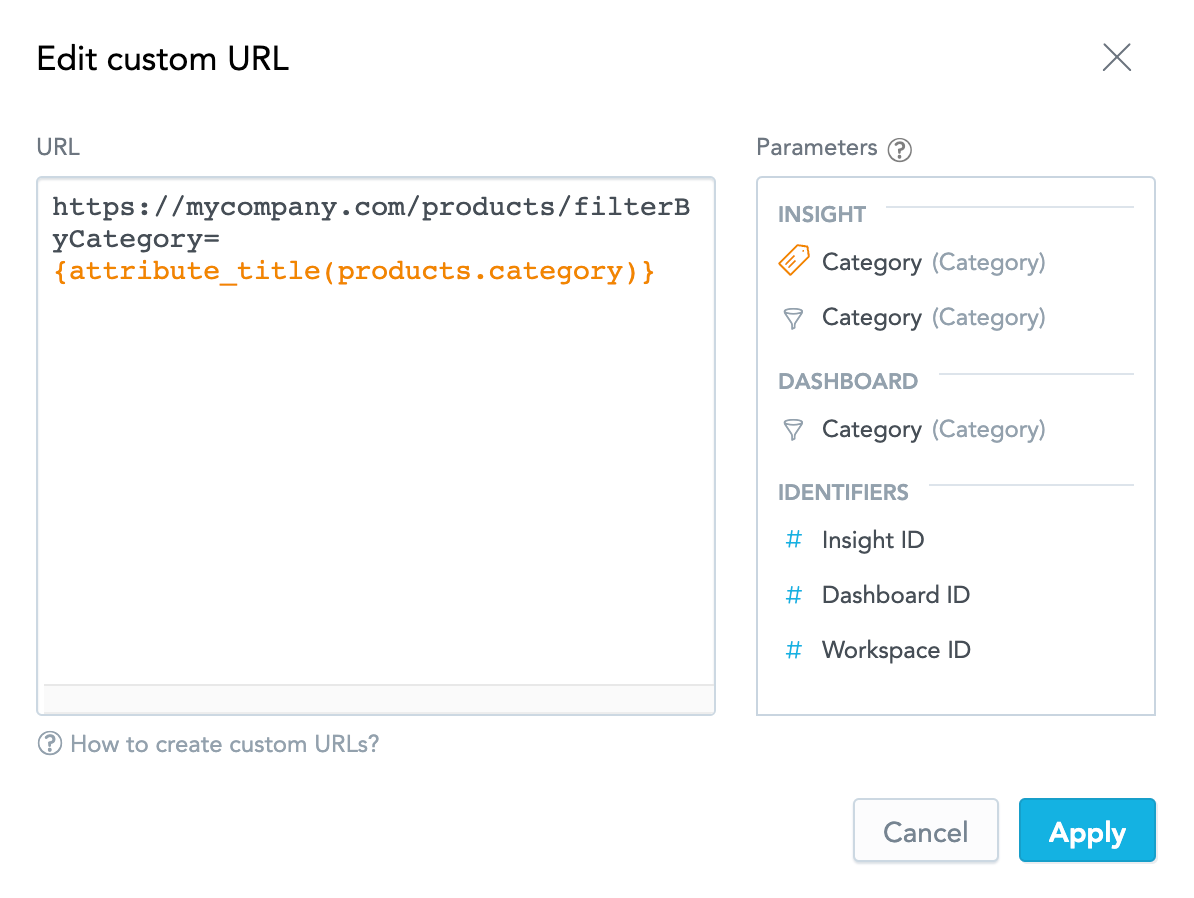
The parameters can be:
- The attribute label you click on.
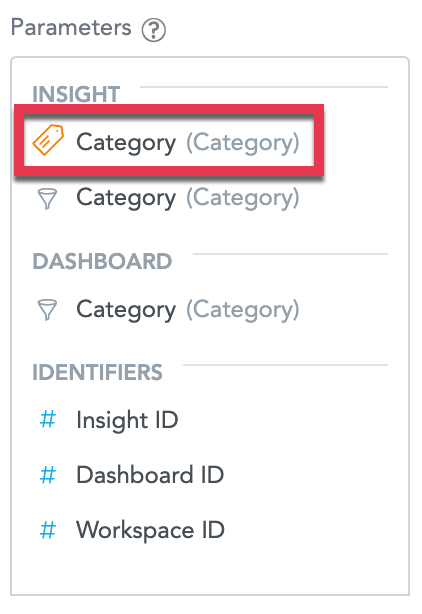
- The value of an active visualization attribute filter that was set when creating the visualization in the Analytical Designer. Date filters are not supported.
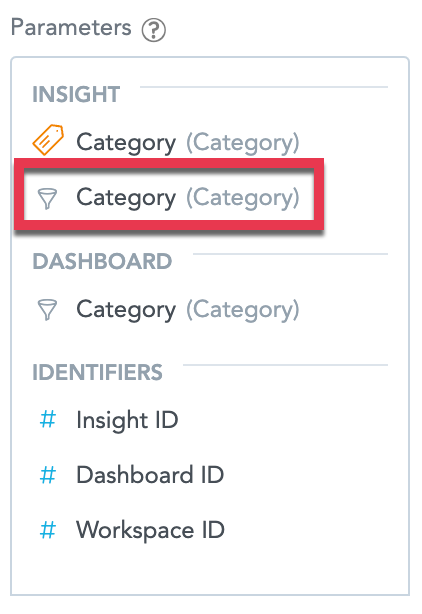
- The value of an active dashboard attribute filter. Date filters are not supported.
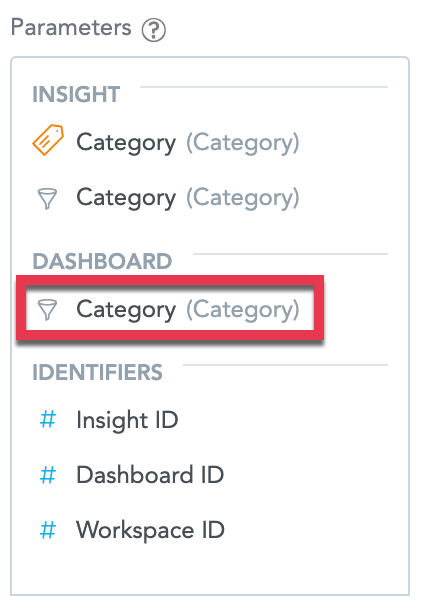
- The ID of the visualization or the ID of the dashboard or workspace it is part of.
Save & Publish your changes.
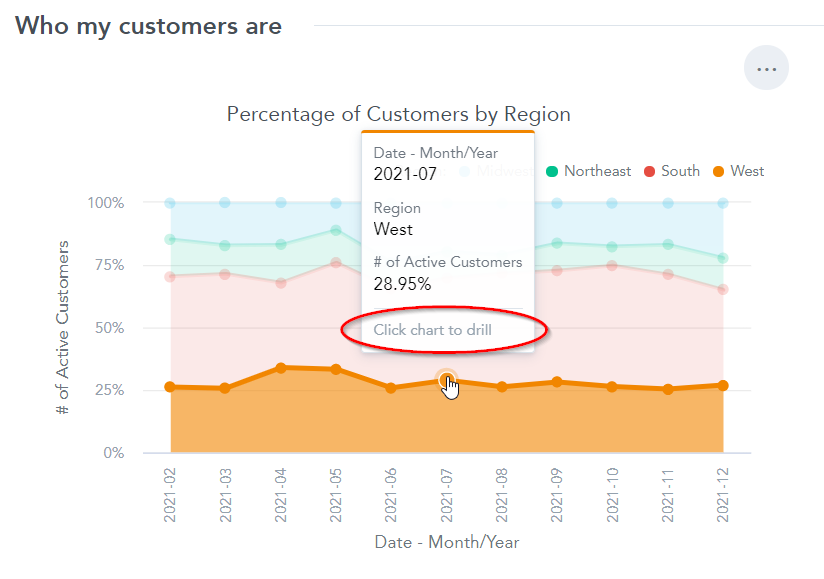
Notice that if you hover over the visualization now, you are able to click on a metric to drill in on it.